Ask any learning and development professional about Kirkpatrick’s Levels 3 and 4 evaluation, and watch what happens. There’s a pause. Maybe a rueful smile, or sometimes a small sigh. We know what those levels mean: behavior change on the job and real business results. They represent the concrete evidence that learning actually did something that mattered beyond a satisfying score on a post-training quiz. Every leader worth their salt wants to get there, but most never do.
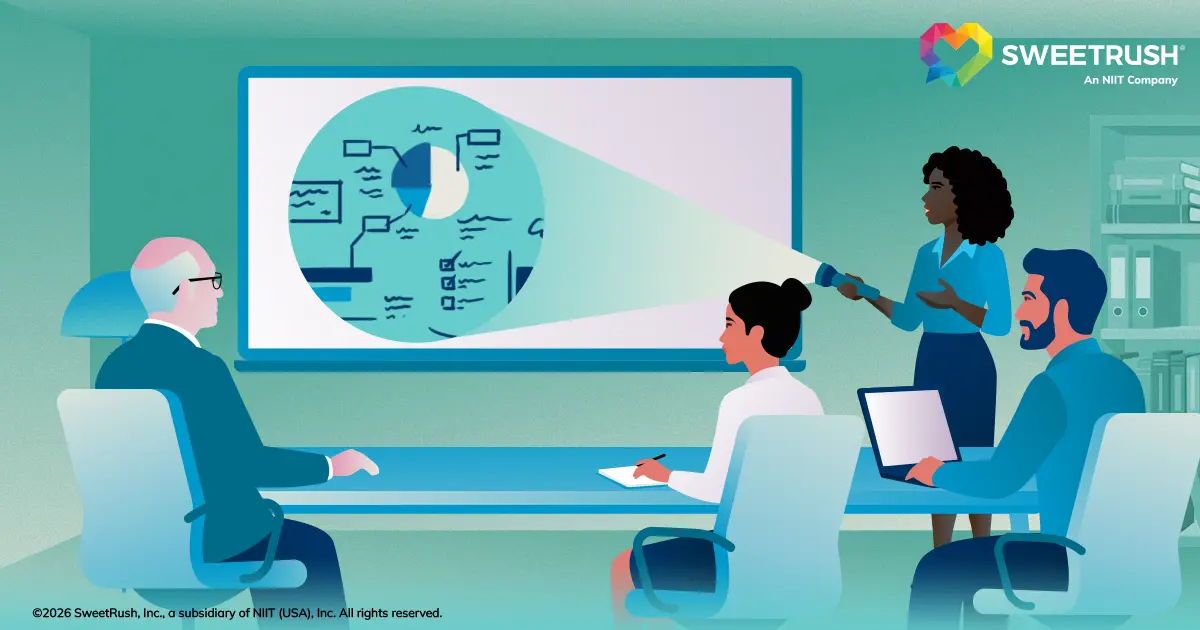
It isn’t for lack of trying or caring. It’s because the evaluation landscape has always been dark, and until very recently, we didn’t have a reliable flashlight.
Today, leveraging AI for L&D measurement offers us that missing flashlight. When we shine it into the data pipeline, the historic barriers disappear, revealing messy, human, qualitative, and abundant data that organizations have always possessed—but never knew how to interpret at scale.
The evaluation problem was never our strategic destination; it was the limitations of the tools we had for the journey.
Donald Kirkpatrick gave us a four-level evaluation model that remains the global standard for training evaluation more than six decades after its introduction. The logic is elegant: measure learners’ reaction, then learning, then behavior change and, finally, business results. Each level builds on the previous one, and each becomes more complex to collect.
Level 1 is easy. A post-training survey takes ten minutes to build and five minutes for a learner to complete. Level 2 is manageable via a post-course assessment in our LMS.
Levels 3 and 4 are where the model has broken down in practice. That’s not because these levels are flawed, but because the data collection required to reach them has been too expensive, too slow, and too dependent on human effort to sustain.
The result is a “cascade break,” in which:
These add up to four disconnected events. Cue the darkness. Most L&D leaders have made their peace with feeling around in the dark. We report what we can easily see and measure, and make the best qualitative case we can for the rest. But in a budget environment where the learning function is perpetually at risk of being labeled a luxury, making “the best case we can” for our programs is no longer enough.
AI doesn’t eliminate the challenge of measuring behavior change and business impact. But it does remove several of the barriers that have kept us in the dark and it addresses both levels simultaneously and at scale
The reason Level 3 measurement has always been so hard is that it required busy learners to stop working and self-report via surveys, manager observations, or follow-up interviews. As a result, response rates are low, timing is inconsistent, and the data we get is filtered through memory and self-perception.
Deploying advanced tools like personalized AI coaches across a workforce acts as a continuous Level 3 data collection instrument. While the learner interacts with the tool to solve real-world daily problems, the underlying system maps critical macro-patterns. It surfaces where teams get stuck, what questions recur weeks after a training event, and what specific language people use when they are struggling with a concept versus when they have genuinely internalized it. This provides behavioral evidence with a level of fidelity that a delayed 90-day survey could never match.
AI coaching and mentoring tools change this entirely. An AI coach deployed across a workforce is essentially a continuous Level 3 data collection instrument. Best of all, no one experiences it as data collection on the front end. While the learner interacts with the AI coach to solve real-world flow-of-work problems, we’re seeing the patterns on the back end: where people get stuck, what questions recur weeks after a training event, and the language learners use when they’re struggling with a concept versus when they’ve genuinely internalized it. This data provides Level 3 behavioral evidence with a degree of fidelity that a disruptive 90-day survey could never match.
Offering gated resources provides another elegant approach to Level 3 data collection. Rather than asking learners how they feel about their learning, we can observe which resources they reach for, and when. For example, a job aid downloaded six weeks after training tells us something interesting. A job aid downloaded repeatedly by the same person tells us something more interesting still. With this approach, the friction is minimal. The data is behavioral, not self-reported. And the connection between the learning event and the on-the-job application is direct and traceable.
Work product analysis extends our Level 3 data collection efforts still further. If training is designed to change how our people think and communicate, the language in their work outputs—such as proposals, decision memos, or customer communications—is Level 3 evidence. AI can “read” and evaluate those outputs at scale, surfacing patterns no human reviewer could find in a reasonable amount of time.
Connecting learning data to business outcomes has historically required either a dedicated research function or an expensive external partner. The data lived in different systems with no link among them. Running a basic cohort comparison—such as measuring a trained group against an untrained group or early adopters versus late adopters—was so labor-intensive enough that most organizations simply didn’t do it.
Using AI makes this process achievable for L&D teams without a data science methodologist on staff. We can now match learner identities across platforms, bridge previously disconnected enterprise systems, and build a defensible picture of performance shifts following training. It’s not quite a randomized controlled trial, but it is far more rigorous than a testimonial or smile sheet.
Critically, AI also helps us understand the data we’re seeing, which matters more than it might seem. Misinterpreted data can be worse than no data at all, and superficial statistical knowledge can be a genuinely dangerous thing.
Imagine that someone runs a correlation, sees a number, and presents it to the executive team with more confidence than the data warrants. AI as an interpretive thought partner can explain what the analysis shows, what it doesn’t show, and what we should be cautious about before presenting a finding in the boardroom. That’s a check most L&D teams have not historically been able to access without specialized expertise.
Business outcomes take time. Revenue, retention, and customer satisfaction are lagging indicators that may not reflect the impact of training for months or years. AI makes it feasible to identify and measure the leading indicators that historically predict those longer-term outcomes in our own organizational data.
What behaviors, measured at 30 days, reliably predict the performance outcomes we care about at 12 months? That’s a question AI can help us answer—and one that yields defensible Level 4 evidence while we wait for the lagging data to arrive.
Jack Phillips extended Kirkpatrick’s model with a fifth level: ROI. His logic is straightforward: Convert our Level 4 business results to a monetary value, subtract the cost of training, and express the net return as a clear percentage
ROI is a powerful argument for the value of the learning function in budget conversations. Unfortunately, it’s been largely theoretical for most organizations, because we can’t calculate ROI without solid Level 3 and 4 data. Nobody could reach Level 5 because we couldn’t reliably reach Levels 3 and 4.
When we repair the foundation, Level 5 becomes attainable for organizations without engaging a full data science team.
Roger Kaufman and John M. Keller added another dimension worth noting: societal and community impact. This dimension sounds abstract until we consider how many organizations are now accountable in ways that extend beyond traditional business metrics.
DEI initiatives, sustainability pledges, safety culture goals, and customer experience standards aren’t soft aspirations. They’re strategic priorities that organizations have committed to publicly, and they’re under pressure to demonstrate progress.
AI makes it feasible to measure learning impact against a richer and more customized set of outcomes than the generic KPI conversation has historically allowed. The sustainability question of whether the behavior change resulting from training persists over time finally becomes answerable.
For example, when we’re measuring against a multi-year DEI roadmap or a long-term safety transformation, there’s a built-in need to know whether the learning was “sticky.” Continuous data collection makes finding that data tractable in a way a one-time survey never could.
Any L&D leader who’s been in the industry long enough has a version of this story.
Consider a common scenario: An L&D team attempts to measure year-end progress on personal development objectives. They create a thoughtful plan to collect data. Learners will write an objective at the beginning of the year and report on their progress at the end. Meaningful qualitative data connected to real work will be generated.
Unfortunately, someone downstream attached a Likert scale to the reporting instrument. And when the need arose to show improvement over time, the data didn’t cooperate. Meaningful change can’t be measured on a Likert scale the way it can from detailed qualitative self-report.
Not surprisingly, given organizations’ numerous competing priorities, these watered-down measurement efforts tend to get scrapped rather than redesigned.
These stories aren’t about incompetence. They’re about hitting a wall without the tools to get past it. And L&D is full of those walls: the 90-day follow-up survey that never happened, the manager observation protocol that was too time-consuming to sustain, the survey instrument that generated data nobody knew how to analyze.
AI doesn’t just give us new tools to overcome these obstacles; it gives us a reason to try again.
For those willing to go further, the possibilities extend well beyond what has historically been within reach for most L&D leaders.
Regression analysis, which predicts future performance based on current indicators, has been theoretically available to anyone with a statistics textbook for decades. Practically speaking, it requires clean, connected data; sufficient volume; and someone who knows how to work with the output. Most L&D teams haven’t had these three things.
That’s all changed. AI makes it feasible to build predictive models based on our own organizational data: models that can tell us, with genuine statistical grounding, which early indicators predict the performance outcomes we care about months down the road.
With AI as a partner, we’re newly able to stop reacting to results and start forecasting them, adjust our focus, and design learning interventions that target the indicators we’re seeking.
The interpretive support matters here, too: We don’t need to remember our college statistics coursework to conduct meaningful analysis. AI can walk us through what the analysis is showing, where confidence is (and isn’t) high, and where to be cautious when presenting findings to leadership. The expertise that used to require a dedicated research function is now accessible to smaller L&D teams—and even a one-person band.
The practical implication of this technical shift is significant: The arguments we’ve used for decades to justify why we cannot consistently deliver Level 3 and 4 data are no longer valid.
Our new data capability is good news: It means that the learning function is becoming more defensible at exactly the moment when defensibility matters most. It shifts the conversation with our CFO or CEO from “Trust us, the program’s working,” to “Here’s what the data shows.” We can finally connect the dots between learning investment and business outcomes.
The room was simply dark because we didn’t have the flashlight to illuminate it. We have it now. The only remaining question is whether we are ready to step inside and switch it on.
Ready to shift your next stakeholder conversation from “trust us” to tangible proof? Connect with our data analytics experts to explore fresh ways to embed measurement into your programs and demonstrate the business value you and your team bring to the table.



Connect with our industry experts on the subjects that matter most to you.

SweetRush delivers innovative learning and development solutions, including custom eLearning, immersive training, and talent development strategies.


